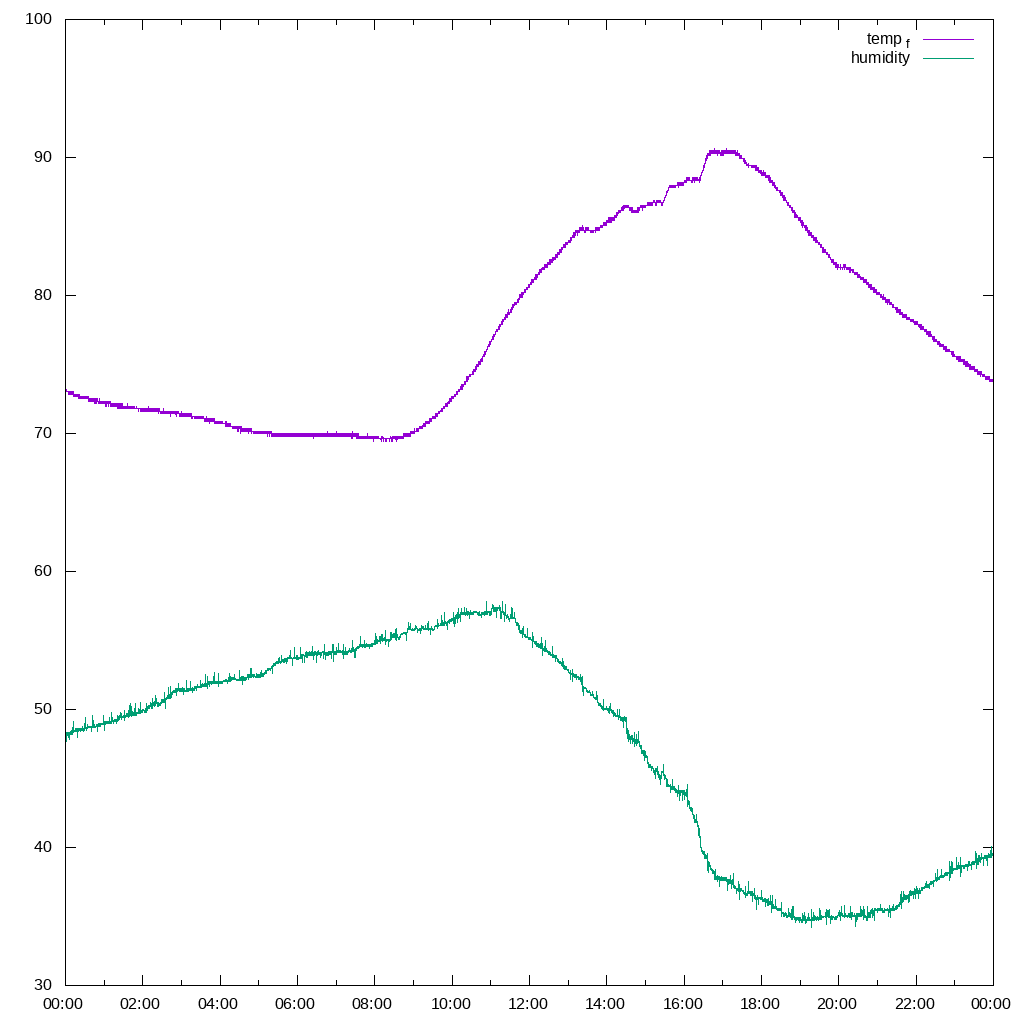
Measuring Storage Closet Temperature and Humidity with a Raspberry Pi
We live in Silicon Valley, which means our house is too expensive and too small. So, unlike my parents’ old house in the midwest, we don’t have the luxury of a basement with consistent year-round temperature and humidity for long-term storage.
We moved some of our long-term storage into the house, some into the attic, and some into the garage. But I’ve been concerned about temperature and humidity swings, especially during the rainy season and when it gets extremely hot in late summer.
I bought a steel storage closet from Uline, a Raspberry Pi Zero, and an AM2302 temperature-humidity sensor. The AM2302 is just a DHT22 with the pull-up resistor built-in, so installing it is as simple as soldering three wires onto the Raspberry Pi.
Reading the Sensor
Then the question became how to read it from software. Standard tutorials suggest using Adafruit’s Python DHT module. It works, reading the sensor every couple seconds will consume nearly the entire Raspberry Pi Zero’s single core. That’s because it uses Linux’s memory-mapped GPIO interface to communicate with the sensor. It sets scheduling priority to realtime, bit-bangs the GPIO pin, and then busy-loops to poll for signal edges.
(The DHT22 uses a bespoke one-pin signaling protocol where bits are distinguished by whether voltage is held high for shorter than or longer than about 40 microseconds. The idea is that you measure the time between all 80-some edges and compute bits.)
I had hoped to use the CPU for things in addition to busy-polling, so I wondered if there was a more efficient way to read the sensor. Well it turns out the kernel now supports a character device interface using ioctls that delivers edge transitions as a stream of events that can be read. Sounds perfect! Unfortunately, even with a minimal C program, transitions were being missed, and I couldn’t reliably parse a result packet. My guess is the kernel isn’t polling the pin signal frequently enough, so transitions are dropped.
Polling the pin in userspace is too expensive, and the gpio character device interface didn’t work, but fortunately recent kernels include an IIO (Industrial I/O) driver that speaks the DHT11/DHT22 protocol. The driver registers an interrupt timer to reliably poll the signal at a high enough frequency to read every transition, and exposes the results as files in sysfs. Reading values with the dht11 driver on the Raspberry Pi means the CPU stays almost entirely idle, and I don’t have to worry about scheduling other processes.
Recording and Graphing Values
The popular time series database and graphing solution seems to be InfluxDB and Grafana these days, but after going through the setup tutorial for those, I decided I didn’t want to deal with containers and security updates and running complicated software on my home network. Given my very limited free time these days, I optimize for systems with extremely low maintenance costs, even if they require more up-front work. (This happens to be why I replaced WordPress with something based on Jekyll, too.)
Thus, I wrote a tiny HTTP server with Hyper that simply writes recorded values and their timestamps to CSV files.
Then, a separate program invokes gnuplot to output PNG graphs into a dedicated folder on my NAS.

Simple, solves for my needs, and gives me the option to import data from CSV into InfluxDB and Grafana later, if desired.
Next Steps
Next, more sensors! Besides temperature and humidity from various parts of the house, recording indoor carbon dioxide would be useful.
I also need to automate the creation of SD card images. So far, I’ve manually assigned IP addresses and configured systemd units on the NAS and each device, but that’s getting unwieldy, especially since SD cards are likely the first thing to fail on a Pi.
Now that I have reliable data, I’ll probably experiment with placing insulation between the storage unit and the wall, and placing some closed bags of charcoal inside the (enclosed) unit to see if it reduces humidity movement through the day.