GLScry
Overview
GLScry is a high-level OpenGL performance analysis tool, developed under the supervision of Dr. Dirk Reiners at Iowa State University. It provides a set of low-level benchmarking primitives and a Python interface for writing high-level tests to measure things such as fill rate with different states enabled, state change costs, vertex cache effect, texture upload rates vs. format, existence of early Z techniques, cost of lights, performance of vertex buffer formats, etc.
GLScry is open source software, licensed under the terms of the GNU Lesser Public License (LGPL). See COPYRIGHT.txt for details.
Motivation
Aren't there other tools that measure OpenGL performance? Yes, a few. They tend to be very specific and hard to extend: for example, measuring shader performance. They also don't make it easy to programmatically wrap them for specific purposes. Eventually this project will be embedded into a tool for the OpenSG scene graph that optimizes your scene graph based on the current hardware's characteristics.
What's the name mean?
The term 'scry' means to look into the future or the unknown through a crystal ball. Since video card manufacturers aren't giving specific performance characteristics of their GPUs, let GLScry be your crystal ball.
Example
from glscry import *
runFor = 2 # seconds
# Specify the geometry we want to render with. The values below are repeated.
repeat_v = (5, 5, 0) + (5, 6, 0) + (6, 6, 0)
repeat_n = (1, 0, 0) + (0, 1, 0) + (0, 0, 1)
v = defineArray(Array_f, 3, repeat_v)
n = defineArray(Array_f, 3, repeat_n)
geometry = buildGeometry(GL_TRIANGLES, v=v, n=n)
# Compare the rendering speed of immediate mode vs. vertex arrays.
test1 = ImmediateTest("Immediate", geometry)
test2 = VertexArrayTest("VertexArray", geometry)
# Run the tests.
testList = [test1, test2]
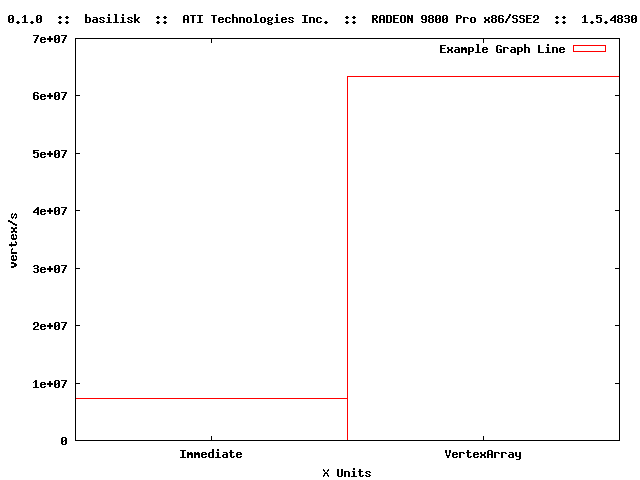
exampleResultList = runTests('Example Graph Line', testList, runFor)
# Using the test results, generate a gnuplot graph script.
generateGraph("example", exampleResultList, "VertexRate", xlabel='X Units')
This produces a graph image like the following:
Download
If you do download and run GLScry, we'd appreciate you sending the results back to us, if you're so inclined.
Warning: Running all of the tests will probably crash your system, especially if your drivers are the slightest bit out of date. So be careful with that (and upgrade your drivers just in case). If you want to just run a couple of the tests, select the test files and drag them on top of run.exe. (Provided you're using the Win32 binaries.) README.txt in the download has more instructions.
- GLScry 0.2.0 - Win32 Binaries
- glscry-0.2.0-win32.exe (2.4 MB, self-extracting 7-Zip archive)
- GLScry 0.2.0 - Source Code
- glscry-0.2.0-src.7z (4.6 MB, 7-Zip archive)
- glscry-0.2.0-src.tar.bz2 (6.0 MB, .tar.bz2 archive)
- glscry-0.2.0-src.zip (9.4 MB, .zip archive)
ChangeLog since 0.1.0
- Replaced old statechange.py with new one.
- Added a new test for comparing state changes side by side.
- Add a statechange for uniforms test.
- Added support for uniforms on the shader state.
- Store different build options files based on the platform.
- Added a transform test.
- Upgrade to new glew and add data types test.
- Added a test for triangle lists.
- Upgraded to Boost 1.32.
- Sort the tests after they're globbed by run.py.
- Added support for multiple batches in one Geometry. Then added a test for multiple triangle strips vs. joining with degenerate triangles.
- Moved batchSize attribute from GeometryTest to Geometry.
- Added documentation.
- Added support for measuring geometry data rate.
- Added a fragment shader test.
- Added a shader switch test.
- Added a GLSL ShaderState.
- Got rid of DisplayListTest in lieu of ImmediateTest.useList
- Got rid of CompiledVertexArrayTest in lieu of a flag on VertexArrayTest.
- Add multitexturing support to the TextureState class.