Reporting Crashes in IMVU: Creating Your Very Own Symbol Server
With minidumps or a bit of hand-rolled code, it's pretty easy to report symbolic C++ stack traces whenever your application crashes. But reporting is just one side of the coin. Once you begin collecting crash reports, you'll need a way to read them. As I mentioned before, you can generate some MAP files and look up your functions manually, but Microsoft provides some lesser-known tools that take care of this for you.
Why should I run my own symbol server?
- Once you create a symbol server, you can easily debug a release build of your program from any computer with network access to the symbol server.
- Existing tools such as WinDbg and Visual Studio play nicely with symbol servers.
- Creating a symbol server is easy: it requires a single download and a directory on a network share.
- Symbol servers can be cascaded. Microsoft runs a symbol server for their operating system DLLs, so entries from both your code and system DLLs will be displayed in a single call stack.
What is a symbol server?
If you compile your program with the correct options, the compiler and linker will generate symbol files (PDBs). PDBs contain information required to parse stack traces and locate identifiers in your program. A PDB also contains the signature of the DLL or EXE associated with it. A symbol server is a directory of PDBs, organized by signature. Thus, given a DLL or EXE, you can find its PDB signature (the PdbSig70 and PdbAge fields in the corresponding debug PE header) and look up the PDB in the symbol server directory.
Creating the symbol server
Download and install the Debugging
Tools for Windows. Make sure symstore.exe is in your path.
Create a directory on an accessible network share. Note the full path; you'll need it later. Ours is \\hydra\devel\SymbolServer.
Every time you release your software, add the generated PDBs to the symbol server. Our release script runs this command:
symstore.exe add /s \\hydra\devel\SymbolServer /compress /r /f *.pdb /t IMVUClient
This command takes a while to run, but it simply searches for PDBs and indexes them in the SymbolServer directory by their signature so Visual Studio and WinDbg can find them later.
Using the symbol server
There are generally two ways to coerce your debugger to resolve call stacks with your symbol server. You can either set the _NT_SYMBOL_PATH environment variable or configure the debugger with the paths directly.
The syntax for _NT_SYMBOL_PATH is a bit wonky, but it should look something like this:
srv*c:\localsymbols*\\hydra\devel\SymbolServer*http://msdl.microsoft.com/download/symbols
_NT_SYMBOL_PATH behaves just like any other PATH: paths are searched in order until the appropriate PDB is found. To make future lookups faster, if a PDB is found on the network, it will be copied to the local path.
The last entry in the list is Microsoft's public symbol server. This allows the debugger to find function names for Microsoft operating system DLLs.
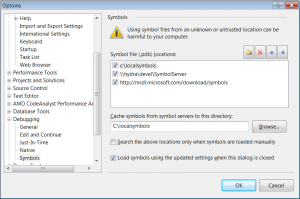
Each debugger generally has its own mechanism for configuring symbol servers. Here's Visual Studio 2005's symbol path editor:
To save time, you may prefer using _NT_SYMBOL_PATH over per-debugger configuration, since it will work with all debuggers.
I hope this information was useful. I certainly wish we'd discovered it years ago. Happy debugging!

